Climate Change Food Security
Drought History
Drought History
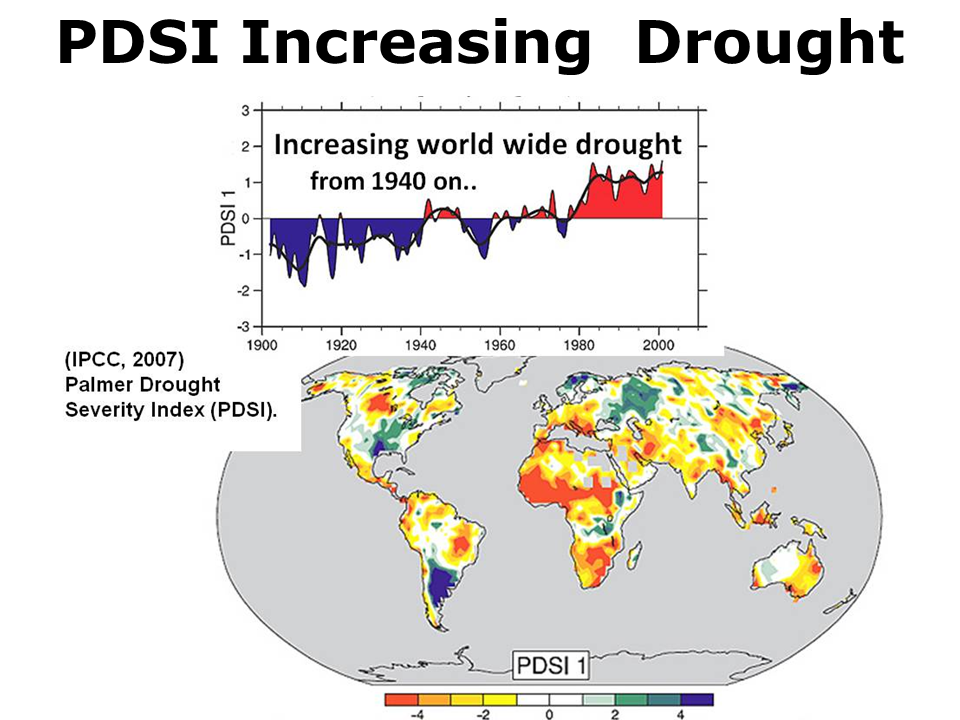
The dryness and drought trend is measured by the Palmer Drought Severity Index. The 'Increasing Drought' map shows the global PDSI from 1900 to 2002 but this does not seem reliable for drought extent under global climate change.
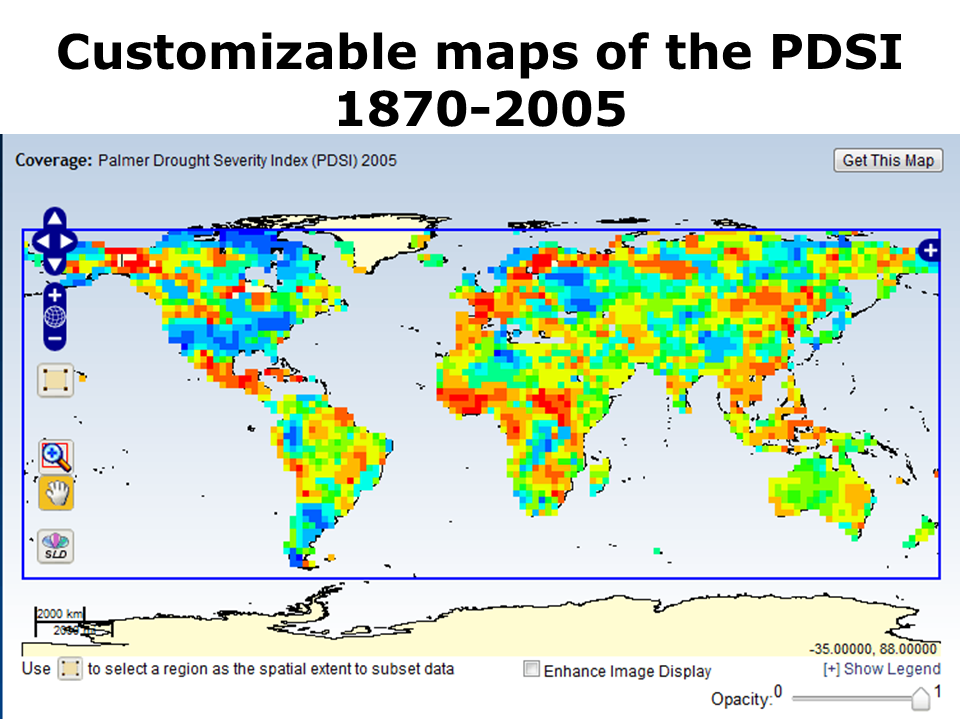
Drought appears to be Increasing though by how much is open to question
The 2007 IPCC assessment reported global drought had been steadily increasing for decades (based on the PDSI and models) but the IPCC 2011 extreme weather report questioned that. US based expert A Dai says globally drought has been increasing since 1910 and it will continue to increase as global warming continues and global temperatures increase. Other model research finds no increase in drought extent and that the standad PDSI does work for drought and climate change.
Northern hemisphere extreme and drought appears to be increasing, affecting all the worlds best food producing regions in 2012. The rapid loss of Arctic cooling snow and ice albedo cooling is projected to increase N. hemisphere drought.
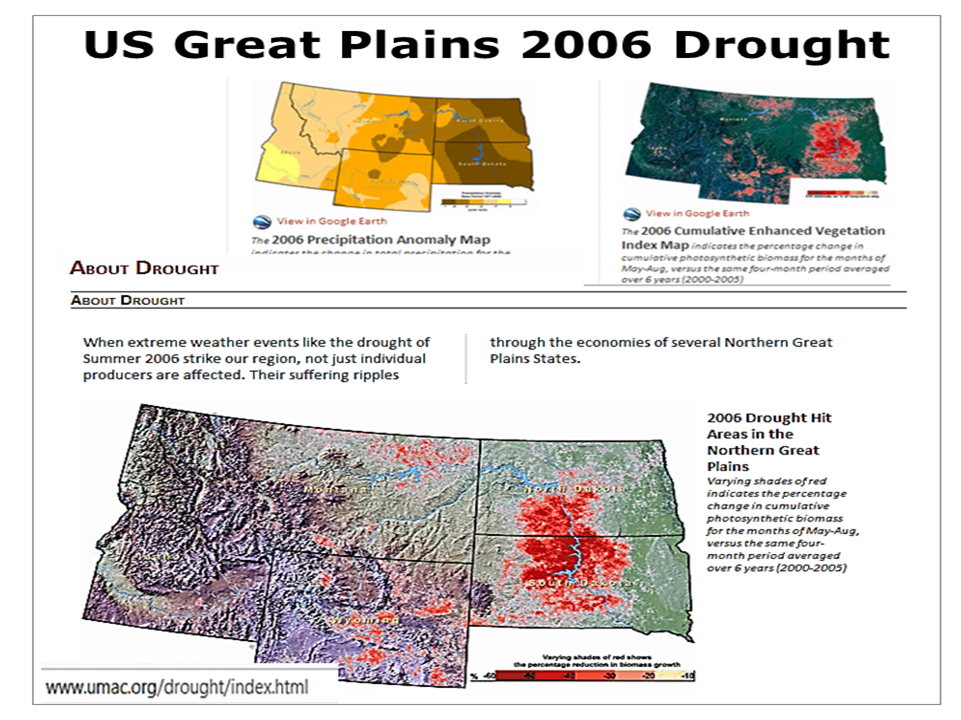
USA The world's most productive agricultural region is the US Great Plains called the world's breadbasket which stretches up to Canada. This region has a recent history and a far distant history of natural vulnerability to drought, and suffered a major drought in 2006. Climate change is projected to increase plains drought (USGS). The NOAA North American Drought Monitor covers this region. For current US drought check US Drought Portal.
According the very long term historic record the region inevitably is going to be hit with severe prolonged droughts and adding global warming is only asking for that to happen sooner and be worse.
NOAA drought
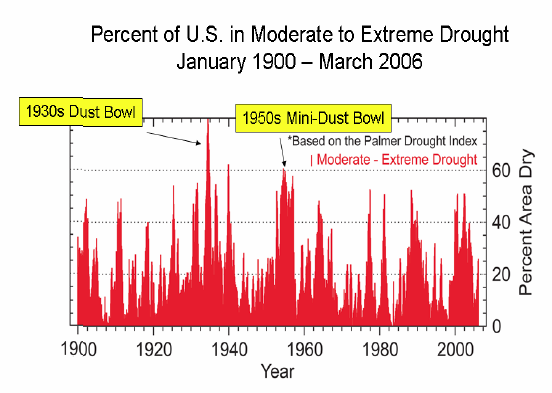
For any given part of the US, moderate droughts have been experienced on average once every 5-10 years, severe droughts once every 10-20 years, and extreme droughts once every 20-50 years.
How Have Droughts Varied Over the U.S. During the Past Century?
• Droughts are a common feature of U.S. climate. The fraction of the country in moderate
or greater drought varies tremendously over time, averaging about 20 percent but ranging
from less than 5 percent to as much as 80 percent.
• Widespread drought can affect the country for many years, such as during the 1930s “Dust Bowl.”
• Drought frequency varies considerably from year-to-year and over decades and longer.
There is little evidence for any systematic trend toward either more or fewer droughts in the U.S.
over the past century.
• The most extensive drought over the continental U.S. in the modern observational record occurred from 1933 to 1938. In July 1934, 80 percent of the U.S. was gripped by moderate or greater drought (Figure 1), and 63 percent experienced severe to extreme drought. During 1953-1957,
severe drought covered up to 50 percent of the country.
• Of the 62 weather-related disasters over the period 1980- 2004 having impacts over $1 billion, approximately one quarter were related to droughts. The costliest recent drought was in 1988, which devastated crops in the Corn Belt, causing a $15 billion loss in agricultural output and
much larger additional indirect economic impacts.
• NOAA paleoclimate research has found that over the past two thousand years the climate of the western U.S. was usually more arid than at present, and within the past millennium severe droughts occurred in the western U.S. and Midwest that lasted for multiple decades
According the very long term historic record the region inevitably is going to be hit with severe prolonged droughts and adding global warming is only asking for that to happen sooner and be worse.
NOAA drought
For any given part of the US, moderate droughts have been experienced on average once every 5-10 years, severe droughts once every 10-20 years, and extreme droughts once every 20-50 years.
How Have Droughts Varied Over the U.S. During the Past Century?
• Droughts are a common feature of U.S. climate. The fraction of the country in moderate
or greater drought varies tremendously over time, averaging about 20 percent but ranging
from less than 5 percent to as much as 80 percent.
• Widespread drought can affect the country for many years, such as during the 1930s “Dust Bowl.”
• Drought frequency varies considerably from year-to-year and over decades and longer.
There is little evidence for any systematic trend toward either more or fewer droughts in the U.S.
over the past century.
• The most extensive drought over the continental U.S. in the modern observational record occurred from 1933 to 1938. In July 1934, 80 percent of the U.S. was gripped by moderate or greater drought (Figure 1), and 63 percent experienced severe to extreme drought. During 1953-1957,
severe drought covered up to 50 percent of the country.
• Of the 62 weather-related disasters over the period 1980- 2004 having impacts over $1 billion, approximately one quarter were related to droughts. The costliest recent drought was in 1988, which devastated crops in the Corn Belt, causing a $15 billion loss in agricultural output and
much larger additional indirect economic impacts.
• NOAA paleoclimate research has found that over the past two thousand years the climate of the western U.S. was usually more arid than at present, and within the past millennium severe droughts occurred in the western U.S. and Midwest that lasted for multiple decades
Norhern hemisphere drought appears to be on the increase over the last half century, driven not only by regional downward trends in precipitation, but also by the drying effect on soils of increasing temperatures and the change in timing of spring snowmelt .Floods and Droughts in a Changing Climate – Now and the Future 29th April 2011, Paul A. Dirmeyer Center for Ocean-Land-Atmosphere Studies Maryland
Europe has a history of drought with extreme heat and drought 1988-9, 2003,2005, 2011, 2012
America extreme heat and drought USA 2002,05,06,08,09,10,11,12
America extreme heat and drought USA 2002,05,06,08,09,10,11,12
o According to Wikipedia US drought history there were extensive droughts through the 2000s all over the Southeastern United States, continuing as far westward as Texas.
o Western US 2000-2004 worst drought in 800 years (not PDSI research)
o Europe 2003 (research - severity has been linked to global warming)
o US 2006 severe great plains drought
o Europe 2006 heat wave
o SW China 2009-2012 multi-year drought. 2011 - 14.5 million people without access to drinking water.
o NH esp Russia 2010 heat wave and drought that was worst in 50 years ( research – severity linked to global warming)
o N. Europe 2011 extreme dry spring
o US Texas 2011 heat wave
o China 2011 Central China’s grain belt worst drought in 60 years.
o US 2012 record heat prolonged severe drought.
o N E British Columbia Canada record drought
Russia
Drought is frequent in the Russian grain belt.
The Golubev and Dronin report gives the following table of the major droughts in Russia.
Central: 1920, 1924, 1936, 1946, 1972, 1979, 1981, 1984.
Southern: 1901, 1906, 1921, 1939, 1948, 1951, 1957, 1975, 1995.
Eastern: 1911, 1931, 1963, 1965, 1991.
Drought is frequent in the Russian grain belt.
The Golubev and Dronin report gives the following table of the major droughts in Russia.
Central: 1920, 1924, 1936, 1946, 1972, 1979, 1981, 1984.
Southern: 1901, 1906, 1921, 1939, 1948, 1951, 1957, 1975, 1995.
Eastern: 1911, 1931, 1963, 1965, 1991.