Climate Change and Food Security
NRC
NRC
Climate Stabilization Targets:
Emissions, Concentrations, and Impacts over Decades to MillenniaNational Research Council 2010
Emissions, Concentrations, and Impacts over Decades to MillenniaNational Research Council 2010
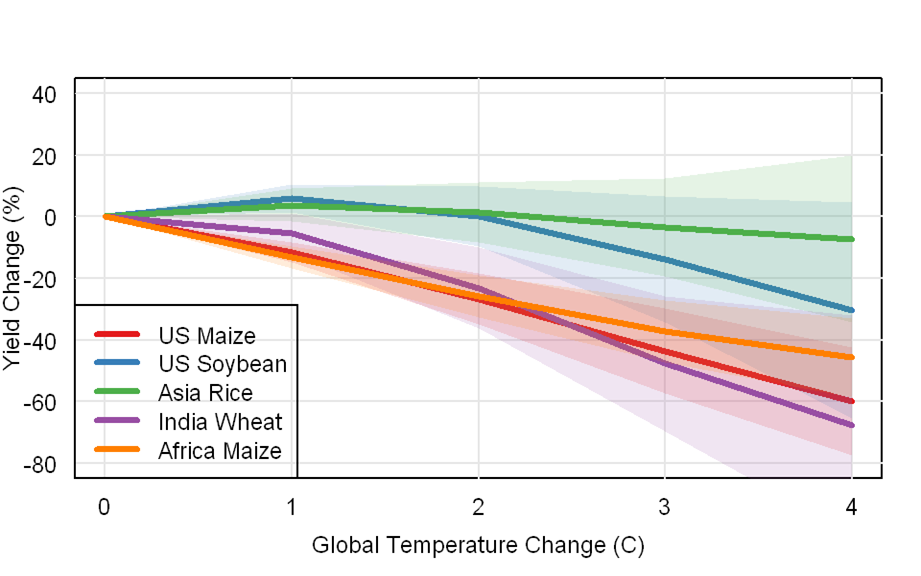
5 -15% yield reductions per degree C of a number of crops
Approximate estimates of effects, include a 5-15% per degree C of global warming,
Approximate estimates of effects, include a 5-15% per degree C of global warming,
The models must be assumed to be considerable under estimates
'The existing literature identifies several prominent sources of uncertainty, including those related to the magnitude of local warming per degree global temperature increase, the sensitivity of crop yields to temperature, the CO2 levels corresponding to each temperature level (see section 3.2), and the magnitude of CO2 fertilization.
'The impacts of rainfall changes can also be important at local and regional scales, although at broad scales the modelled impacts are most often dictated by temperature and CO2 because simulated rainfall changes are relatively small (Lobell and Burke, 2008)
'In addition, although the studies summarized in Figure 5.1 consider several of the main processes that determine yield response to weather, several other processes have not beenadequately quantified.
'These include responses of weeds, insects, and pathogens; changes in water resources available for irrigation; effects of changes in surface ozone levels; effects of increased flood frequencies; and responses to extremely high temperatures. *
'Moreover, most crop modelling studies have not considered changes in sustained droughts, which are likely to increase in many regions (Wang, 2005; Sheffield and Wood, 2008), or potential changes in year-to-year variability of yields. The net effect of these and other factors remains an elusive goal, but these are likely to push yields in a negative direction. '
HOW WILL MAIZE YIELDS IN THE UNITED STATES RESPOND TO CLIMATE CHANGES? NRC
Nearly 40% of global maize (or corn) production occurs in the United States, much of which is exported to other nations. The future yield of U.S. maize is therefore important for nearly all aspects of domestic and international agriculture.
Higher temperatures speed development of maize, increase soil evaporation rates, and above 35 °C can compromise pollen viability, all of which reduce final yields. High temperatures and low soil moisture during the flowering stage are especially harmful as they can inhibit successful formation of kernels. In Northern States, warmer years generally improve yields as they extend the frost-free growing season and bring temperature closer to optimum levels for photosynthesis.
The majority of production, however, occurs in areas where yields are favoured by cooler than normal years, so that warming associated with climate change would lower average national yields. The most robust studies, based on analysis of thousands of weather station and harvest statistics for rain fed maize (>80% of U.S. production), suggest a roughly 7% yield loss per °C of local warming, which is in line with previous estimates (USCCSP, 2008b).
National Academies Press August 2010
http://www.nap.edu/catalog/12877.html
http://www.nap.edu/catalog/12877.html
From the model results the NRC records -
The NRC cautions that - : The expected impacts illustrated in Figure 5.1 (the climate crop models) are useful as a measure of the likely direction and magnitude of average yield changes, but fall short of a complete risk analysis which would, for instance, estimate the chance of exceeding critical thresholds.
a 5 to 15% yield reduction per degree centigrade of a number of crops. (US corn, African corn and Indian wheat).
That means for certain the world is far beyond dangerous climate interference.
Just consider that international policy is still targeting a 2 °C of global warming!!
Just consider that international policy is still targeting a 2 °C of global warming!!
The NRC cautions that - : The expected impacts illustrated in Figure 5.1 (the climate crop models) are useful as a measure of the likely direction and magnitude of average yield changes, but fall short of a complete risk analysis which would, for instance, estimate the chance of exceeding critical thresholds.
Is there a way using these model results to estimate likely critical thresholds ?
The best indicator is to take the temperature increase that puts a crop into decline - peak crop yield.
The best indicator is to take the temperature increase that puts a crop into decline - peak crop yield.
This indicates that global food production is at risk of decline at a global average temperature increase of 1.5° C and all crops in all regions are declining below today's baseline at 2.5C. IPCC (2007 WG2
We are committed to an increase of 4C.
Today's global temperature increase :0.8º C
Commitments to future temperature increase
Rapid emissions reduction to atmospheric stabilisation (0.8° C) : 1.6º C
Ocean heat lag almost doubles realised temperature increase : 3.0º C
Aerosol cooling factor deferred warming(0.4-0.9C) : 4.0° C
Commitments to future temperature increase
Rapid emissions reduction to atmospheric stabilisation (0.8° C) : 1.6º C
Ocean heat lag almost doubles realised temperature increase : 3.0º C
Aerosol cooling factor deferred warming(0.4-0.9C) : 4.0° C
Amplifying feedbacks (1.0C at least)
Policy target. : 2.0ºC
Current international proposals
for GHG emissions reductions (Climate Interactive) : 4.5ºC (by 2100)
Current international proposals
for GHG emissions reductions (Climate Interactive) : 4.5ºC (by 2100)
Current global emissions tracking A1F1 : 2.0º C by 2040
: 5.5° C by 2100
: 5.5° C by 2100
- Most crops have been tipped into decline above 1.0ºC
- All are tipped into decline at 1.5ºC
- Most crops below baseline above 2.0ºC
- All crops are below baseline above 2.5ºC
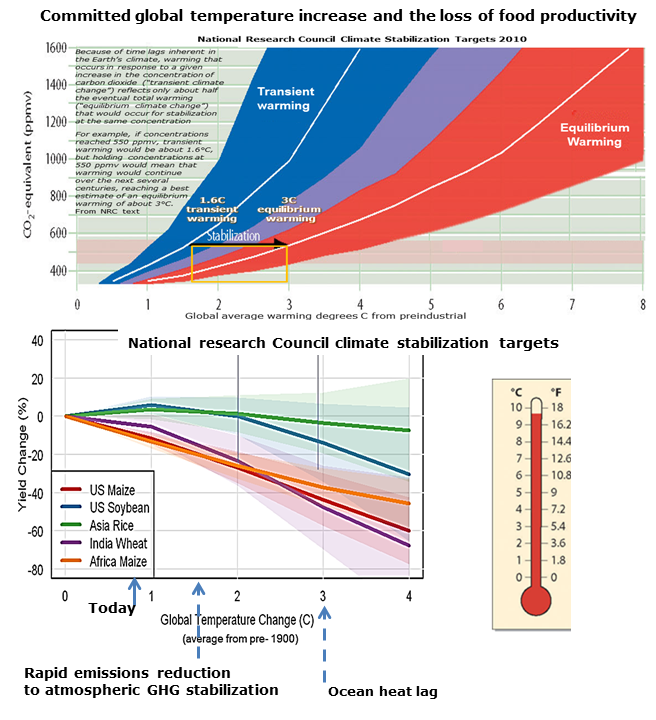
The figure opposite shows two NRC graphs combined to show what food losses we are committed to as the transient temperature is allowed to rise. The upper graph shows the eventual equilibrium temperature increase is always double the transient.
We are 0.8C increase today so all future generations are automatically committed to an increase 1.6C. - unless the planet is cooled artificially or CO2 removed from the air).
Due to the inertia of the climate system at any time there are two global temperature increases to consider. There is today's increase (the realized or 'transient' increase) and the eventual future temperature increase that the transient increase commits the future to (the equilibrium increase).
The NRC says the equilibrium increase is almost double today's transient increase. So if we stopped all GHG emissions on an emergency all out basis the temperature would much more than double.
The three worst impacted regional crops follow about the same declining plot. That puts all three committed to a 20% crop loss of a major crop today.
By the policy of allowing the global temperature to increase to 2C all three are committed to a loss of 20%.
3 big regions & 3 big crops
NRC global tyemperature increase commitment from ocean heat lag with NRC crops yield changes.
Global GHG
emissions are tracking the worst case IPCC scenario (A1FI). This is a model of
the A1FI rate of projected temperature increases
The worlds best food producing in the temperate N. hemisphere are committed to suffering large losses.
This NRC report is in fact a comprehensive global climate change risk assessment. As such it is the latest and arguably the best on the food security.
This NRC report is in fact a comprehensive global climate change risk assessment. As such it is the latest and arguably the best on the food security.
For C3 crops, rice, wheat, soy beans, fine grains, legumes the negative effects of warming are often balanced by positive CO2 effects up to 2-3°C local warming in temperate regions, after which negative warming effects dominate. This corresponds to roughly 1.25-2°C in global average temperature. For C4 crops, Maize, sugar cane, millet, sorghum even modest amounts of warming are detrimental in major growing regions given the small response to CO2.
NRC 2010