Climate Change and Food Security

Science IPCC
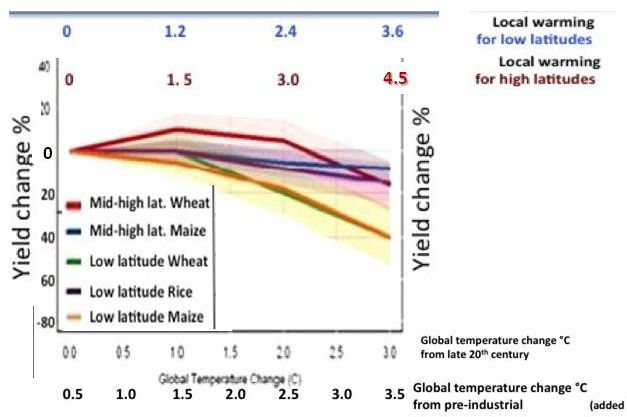
The IPCC in the 2007 assessment it's the results from the climate crop models as the percentage in regional crop yield changes from local temperature changes from year 2000.
As climate change policy is assessed in terms of the global average temperature changes from pre 1900 is necessary to make a conversion of the IP CC model results.
To convert the IP CC projected temperature changes from year 2000 pre 1900 the IP CC science of working group has a 0.5° C correction.
Strictly speaking the NRC conversion from late 20th century would be 0.6° C.
The IPCC says that the climate models do not have adequate resolution for local temperature and climate changes. Nevertheless in the crop model assessment and the temperature changes are recorded as local.
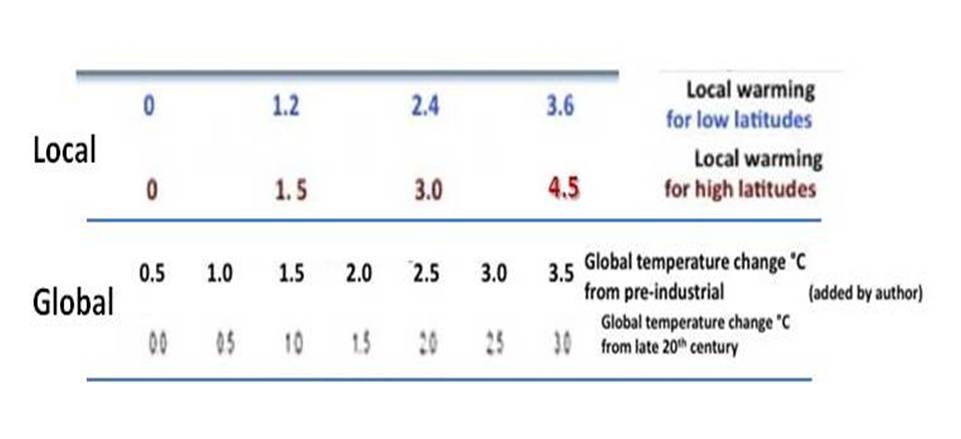
The IPCC does not provide equivalent global average temperature changes for these local temperature changes. This is provided by the national research council assessment of 2010.


(Stabilization Targets for Atmospheric Greenhouse Gas Concentrations. 2010.
Committee on Stabilization Targets for Atmospheric Greenhouse Gas Concentrations.
National Research Council http://www.nap.edu/catalog/12877.html page 129)
Committee on Stabilization Targets for Atmospheric Greenhouse Gas Concentrations.
National Research Council http://www.nap.edu/catalog/12877.html page 129)
For C3 crops, the negative effects of warming are often balanced by positive CO2 effects up to 2-3 °C local warming in temperate regions, after which negative warming effects dominate. Because temperate land areas will warm faster than the global average, this corresponds to roughly 1.25 -2 °C in global average temperature.
The graph below is from the same NCR report and this graph is taken from the IPCC 2007 assessment.
The NRC graph provides equivalent global average temperature increase from the late 20th century for low latitude local warming and high latitude local warming. From this the conversion chart is derived.
The NRC graph provides equivalent global average temperature increase from the late 20th century for low latitude local warming and high latitude local warming. From this the conversion chart is derived.
The IPCC absolute limit to crop tolerance before decline- from models
3.0° C from 2000, which is 3.5° C from pre-1900
That makes the absolute limit for temperate regions and world agriculture. 2.7° C
.
3.0° C from 2000, which is 3.5° C from pre-1900
That makes the absolute limit for temperate regions and world agriculture. 2.7° C
.