Climate change and Food Security
Science: IPCC 4th Assessment 2007
Science: IPCC 4th Assessment 2007
Our commitments to climate change and food production losses
IPCC 4th assessment 2007
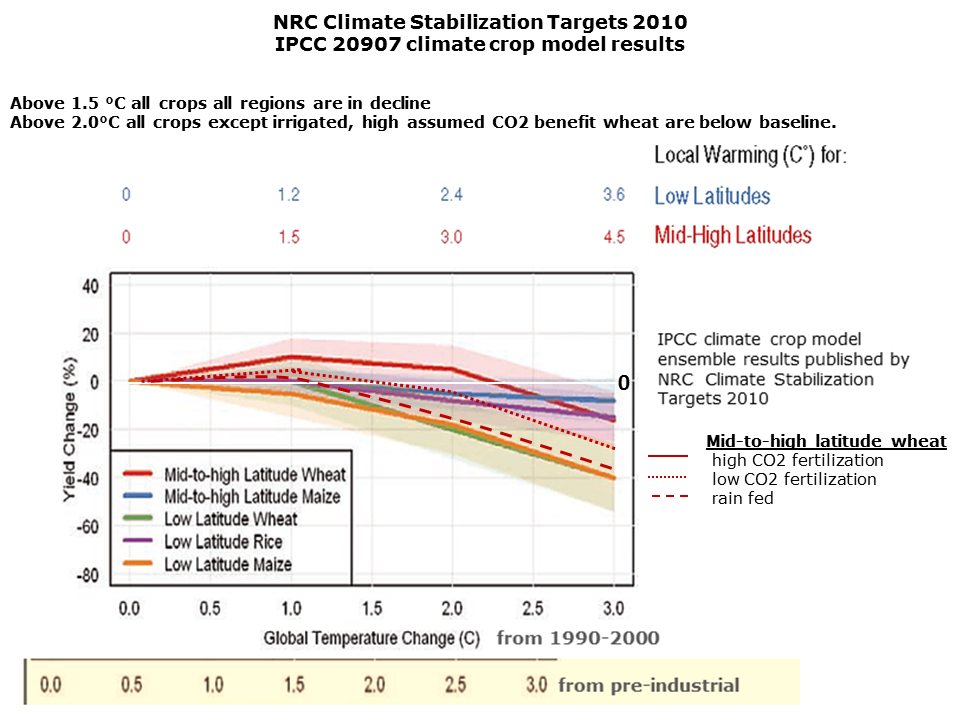
Global crop yield is at risk of decline at a temperature increase of 1.0°C (IPCC 2007 AR4 5.4.2.2 p.285 Review of crop impacts versus incremental temperature change .
ALL CROPS
IN ALL REGIONS
DECLINE
WITH INCREASING WARMING
AND CLIMATE CHANGE
DECLINE
WITH INCREASING WARMING
AND CLIMATE CHANGE
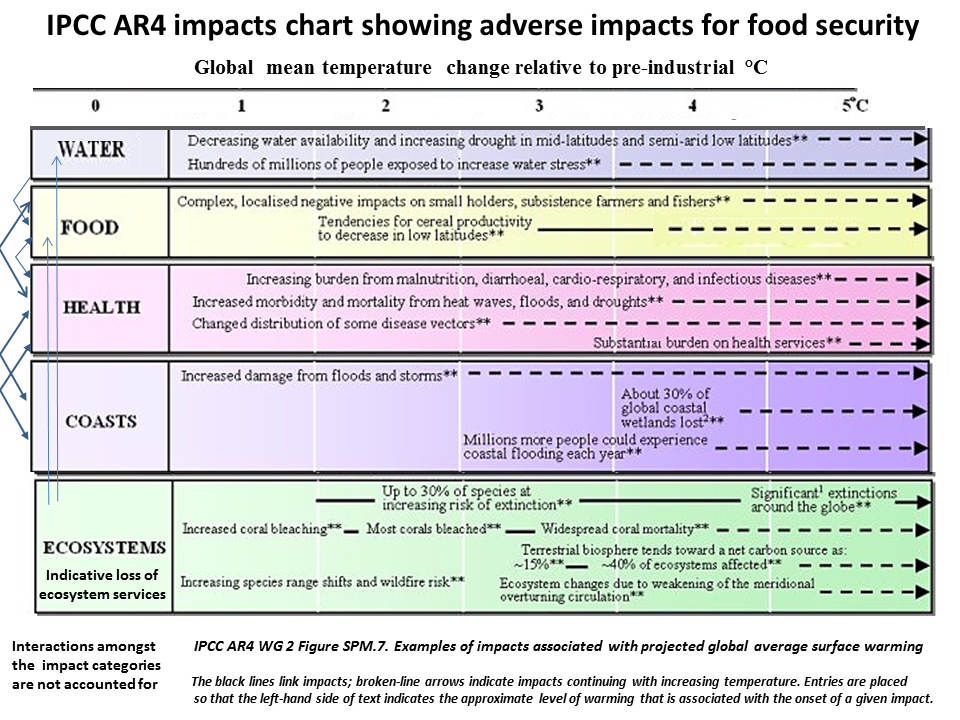
Coasts: models indicate that salination from sea level rise and coastal damage spreads far inland as well as up river estuaries and deltas that are food growing regions.
Health: food production in the developing nations depends on human labour, and human populations in these regions will be badly affected by multiple adverse health impacts from climate change.
Ecosystems and species: even agricultural productivity in developed nations depends on the health of the regional ecosystems ('services') and biodiversity, one example being pollinators.
Water: both extremes of precipitation and drought that will be increased by global climate change disaster on food productivity.
Small glaciers: huge populations depend on seasonal spring run-off from small mountain top places for crop irrigation. Melting the lease will initially cause flooding of the agricultural regions they feed into followed over time by progressively less naturally irrigating water for crop production.
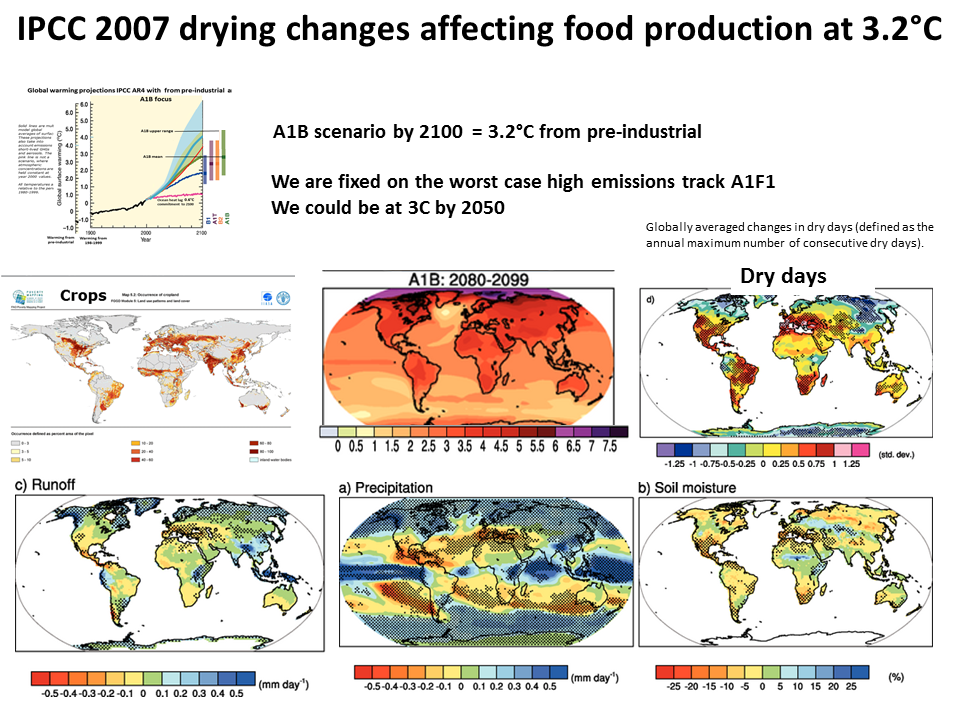
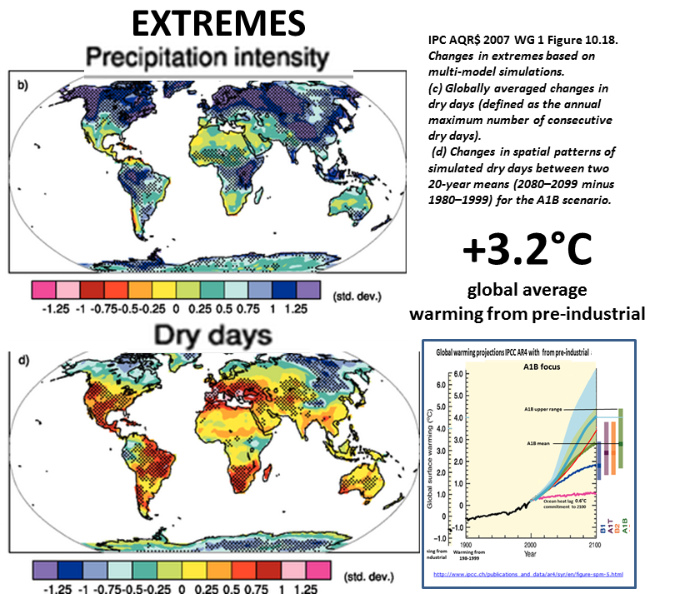
The IPCC presentation has circled in black the world's best food producing regions that will be hit by increased dryness and droughts. .
Change in wet and dry days mid A1B scenario 2000 to 2080. IPCC 2007
NB. Too much and too little rain are damaging to crops
NB. Too much and too little rain are damaging to crops
The IPCC assessment on food relies on climate crop models. In addition to the food production losses that are captured by the models, other adverse impacts (added to the above chart) will greatly added to further crop losses such as drought, drying, torrential rains and floods (ie extreme weather events).
N.B. the IPCC assessment of food impacts is not a risk assessment, as pointed out by the National Research Council greenhouse gas report in 2010 because large impacts are not captured by the climate crop models.
IPCC AR4 2007 WG 2 SPM
Crop productivity is projected to increase slightly at mid - to high latitudes for local mean temperature increases of up to 1-3°C (1 - 2.6C global from pre-1900) depending on the crop, and then decrease beyond that.
At lower latitudes, especially seasonally dry and tropical regions, crop productivity is projected to decrease for even small local temperature increases 1.0 -2°C (0.8- 1.5C Global from pre-1900)
Globally, the potential for food production is projected to increase with increases in local average temperature over a range of 1.0-3°C (1- 2.6C global from pre-1900), but above this it is projected to decrease.
Increases in the frequency of droughts and floods are projected to affect local crop production negatively, especially in subsistence sectors at low latitudes. (IPCC 2007)
.
Globally, some 3.6 billion ha (about 27% of the Earth's land surface) are too dry for rain fed agriculture.
Considering water availability, only about 1.8% of these dry zones are suitable for producing cereal crops under irrigation.
IPCC 2007
This is the worst case IPCC scenario that global emissions are tracking

The climate crop models on which the IPCC relies to assess global climate change impacts on food production fail to capture about half the many inevitable impacts.
The scientists think that the CO2 fertilization positive effect from experiments in artificial environments are over estimates of the real world benefits for agriculture.
Even so, the IPCC climate crop models are based on CO2 research lab benefits.
Even so, the IPCC climate crop models are based on CO2 research lab benefits.
Global climate change will take progressively more land out of food production as temperatures increase. There is an established trend of increasing global droughts since 1860 and there is total agreement that under increased global warming droughts will increase.

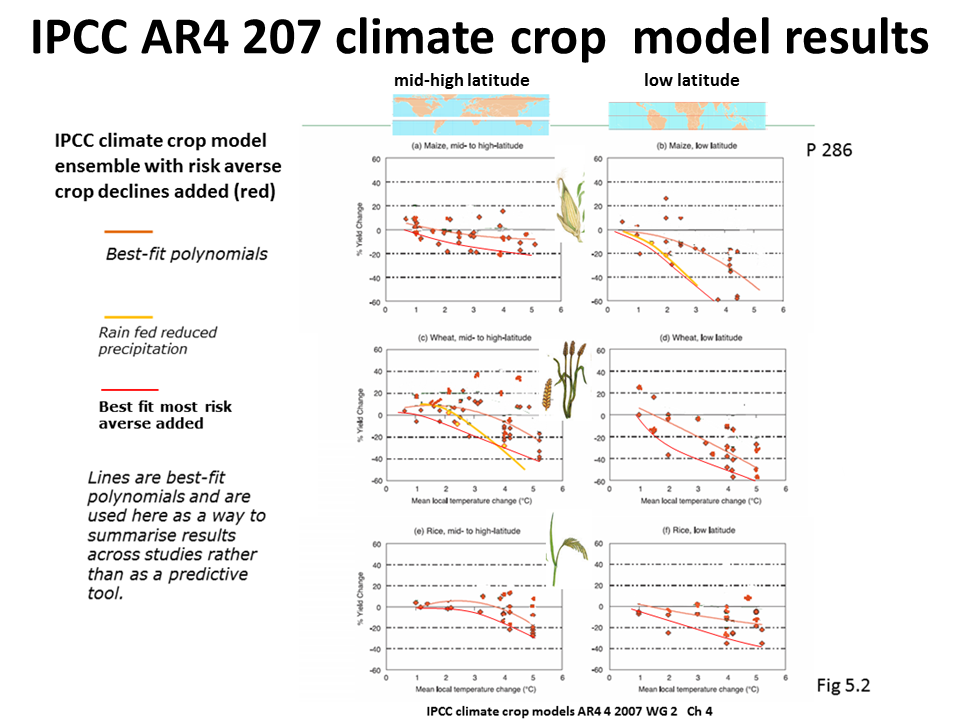
N.B IPCC AR4 model results chart Fig 5.2 opposite correctly says that the results are not to be used for predicting because the model data and development (still in process) does not justify predictions. However the IPCC report to policy makers is based on these inadequate results.
5.4.2.2 Review of crop impacts versus incremental temperature change.
The results of such (computer model) simulations are generally highly uncertain due to many factors, including large discrepancies in GCM (different models) predictions of regional precipitation change, poor representation of impacts of extreme events and the assumed strength of CO2 fertilisation.
However the assumed temperate region yield increase may not happen because the above linear IPPC model results to not capture extreme events.
5.4.2.2 Review of crop impacts versus incremental temperature change.
Nevertheless, these summaries indicate that in mid- to high-latitude regions, moderate to medium local increases in temperature 1ºC to 3ºC (1C - 2.6C global from pre-1900), across a range of CO2 concentrations and rainfall changes, can have small beneficial impacts on the main cereal crops. Further warming has increasingly negative impacts.
In low-latitude regions, these simulations indicate that even moderate temperature increases 1ºC to 2ºC (0.8-1.5C global pre-1900) are likely to have negative yield impacts for major cereal crops.
For temperature increases more than 3°C (2.6C global from pre-1900), average impacts are stressful to all crops assessed and to all regions.
The low and mid-to-high latitude regions encompass the majority of global cereal production area. This suggests that global production potential, ..., is threatened at +1°C (1C global from pre-1900) local temperature change and can accommodate no more that +3°C (2.6C global from pre-1900) before beginning to decline.
However the assumed temperate region yield increase may not happen because the above linear IPPC model results to not capture extreme events.
Modelling studies suggest that increasing frequency of crop loss due to extreme events, such as droughts and heavy precipitation, may overcome positive effects of moderate temperature increase
Note. Local temperature changes are converted to global temperature levels using a value of 1.5°C local per global °C for mid-to-high latitudes and 1.2°C local per global °C for low latitudes (NRC). From 2000 temperature increases are converted to from pre-industrial by adding 0.5° C (IPCC)